Posts

Showing posts with the label stress strain diagram

Stress strain Diagram part-2

Image
Elastic Region (Point 1 –2) When we start to apply tensile pull on the specimen, the stress and strain develops,keeps on increasing in a  proportional  manner upto elastic limit. The material will return to its original shape after the material is unloaded (like a rubber band). The stress is linearly proportional to the strain in this region. Point 2: Yield Strength: A point where permanent deformation occurs.  (If it is passed, the material will no longer return to its original length.) Tensile Strength (Point 3) The largest value of stress on the diagram is called  Tensile Strength (TS) or Ultimate Tensile Strength (UTS).  It is the maximum stress which the material can support without breaking. Point 4: Strain Hardening If the material is loaded again from Point 4, the curve will follow back to Point 3 with the same Elastic Modulus (slope). The material now has higher yield strength of Point 4. Raising the yield strength by p...
Stress- Strain Diagram Part-1

Image
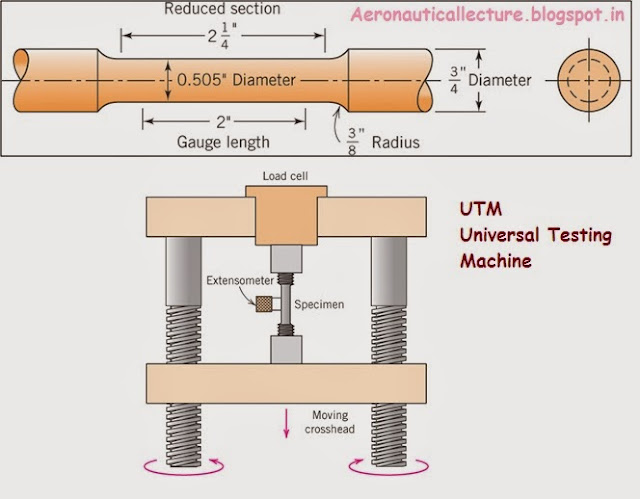
Explain the stress- strain diagram neatly with relevant fig. To select a material for using it in aircraft, we need to know what its life time is.  How much it performs?  and many more requirements. All these are for having a safe flight. The life time and every required factors will be known once if we know stress strain diagram. In order to attain stress strain diagram, we need to have a specimen of desired standards. A standard specimen of the mild steel material is prepared as per BIS standards is given below. Then we need to fix it properly in the universal testing machine. We can give tensile (widely used) or compressive load to the specimen. Load value has to be adjusted very smoothly. By determining the stress and strain at various magnitudes of the load, we can plot a diagram of stress versus strain. Some common terminologies  Load - The force applied to a material during testing. Strain  Gage  or Extensometer  - A devic...